Costa Cálida vs Costa Blanca vs Costa del Sol: What the Official Price Data Shows
Key takeaways
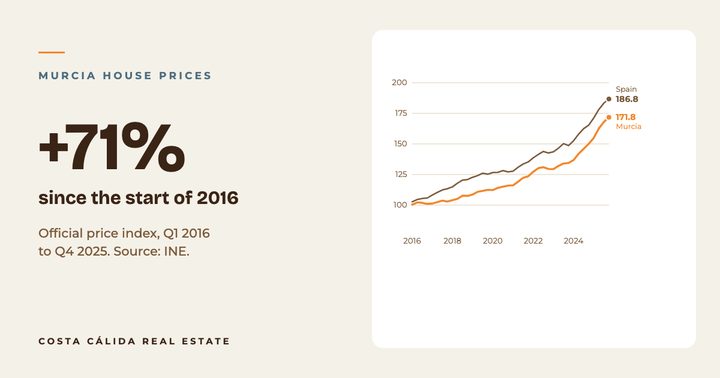
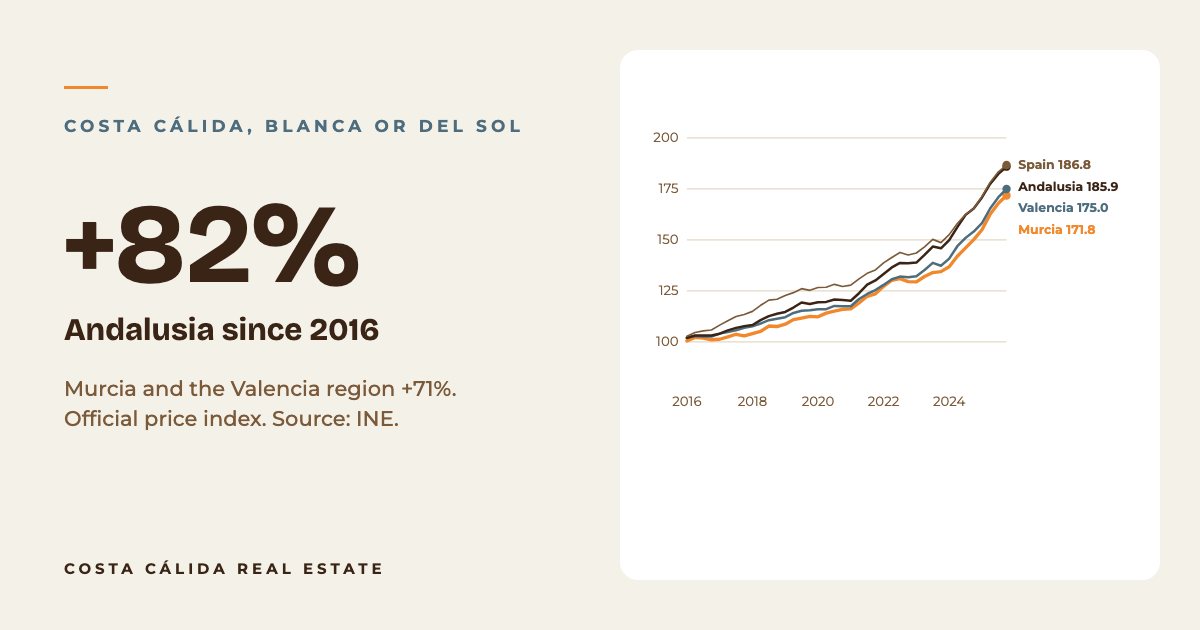
- Since Q1 2016 the official index rose about 71 percent in Murcia and the Valencian Community, 82 percent in Andalusia and 82 percent in Spain.
- In Q4 2025 annual growth was 14.4 percent in Murcia, 13.5 percent in the Valencian Community, 12.4 percent in Andalusia and 12.9 percent in Spain.
- INE publishes these figures by region, not by coast: the Valencian Community includes more than the Costa Blanca and Andalusia more than the Costa del Sol.
- The index shows how prices changed, not what a home costs, so compare real asking prices before you decide.
Many UK buyers compare the Costa Cálida with the Costa Blanca and the Costa del Sol. The official house price index is a good place to start, as long as you know what it can and cannot tell you.
What the data covers#
INE publishes its house price index (2015 = 100) for each autonomous community. That means the Region of Murcia is a close match for the Costa Cálida, but the Valencian Community also includes Valencia and Castellón, not only the Costa Blanca, and Andalusia covers far more than the Costa del Sol. Treat the lines as regional trends, not coast-by-coast prices. The latest quarter I could retrieve is Q4 2025.
Prices since 2016#
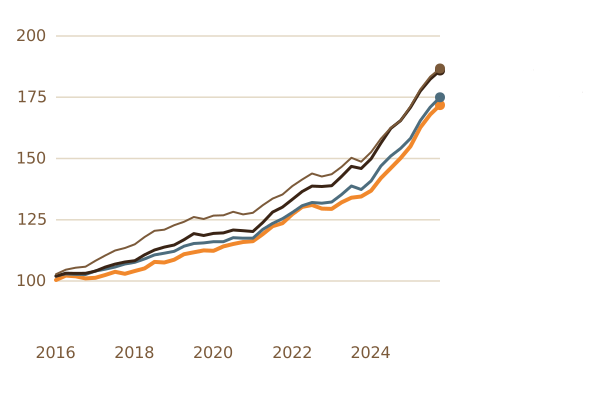
All four started at about 100 to 103 in early 2016. By the fourth quarter of 2025 Murcia stood at 171.8 (up about 71 percent), the Valencian Community at 175.0 (up about 71 percent), Andalusia at 185.9 (up about 82 percent) and Spain at 186.8 (up about 82 percent).
The most recent year#
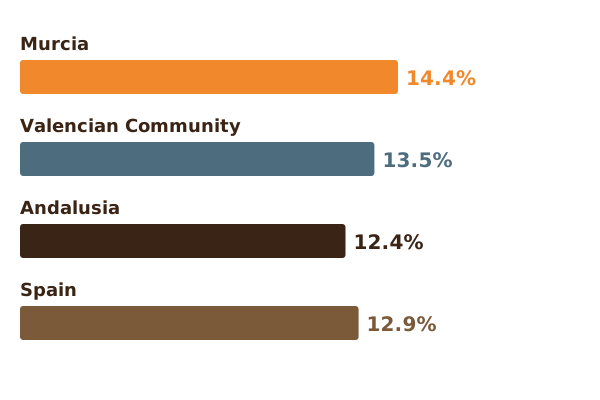
In the fourth quarter of 2025 annual growth was highest in Murcia at 14.4 percent, against 13.5 percent in the Valencian Community, 12.4 percent in Andalusia and 12.9 percent for Spain.
What the numbers do not tell you#
- They show change, not price level. A Costa del Sol home can still cost more than a comparable Costa Cálida home even if the index rose less.
- They look backwards and are not a forecast.
- Local factors matter: distance to the airport, the beach or the golf course, new-build supply, and how tourist rental is regulated.
How to use this#
Use the data to see the direction, then compare real asking prices for similar homes in each area. See our Murcia price guide, explore the Costa Cálida region and look at current properties.
Past growth does not guarantee future growth. This is information, not investment advice.
Sources and further reading
Facts checked: 20 October 2026
Costa Cálida Insider
Get our monthly Murcia market report
Real figures on prices, mortgage rates and buying costs, plus a few homes we have looked at properly. Free, about once a month. Sign up and read our free buying guide straight away.
Thinking of buying on the Costa Cálida?
Talk to us about your plans. We guide you in Dutch or English, from the first call to the keys.
This article is general information and not legal, tax or financial advice. Rules change, so check your own situation with a qualified adviser. Read our full disclaimer.